
Key Takeaways (TL;DR)
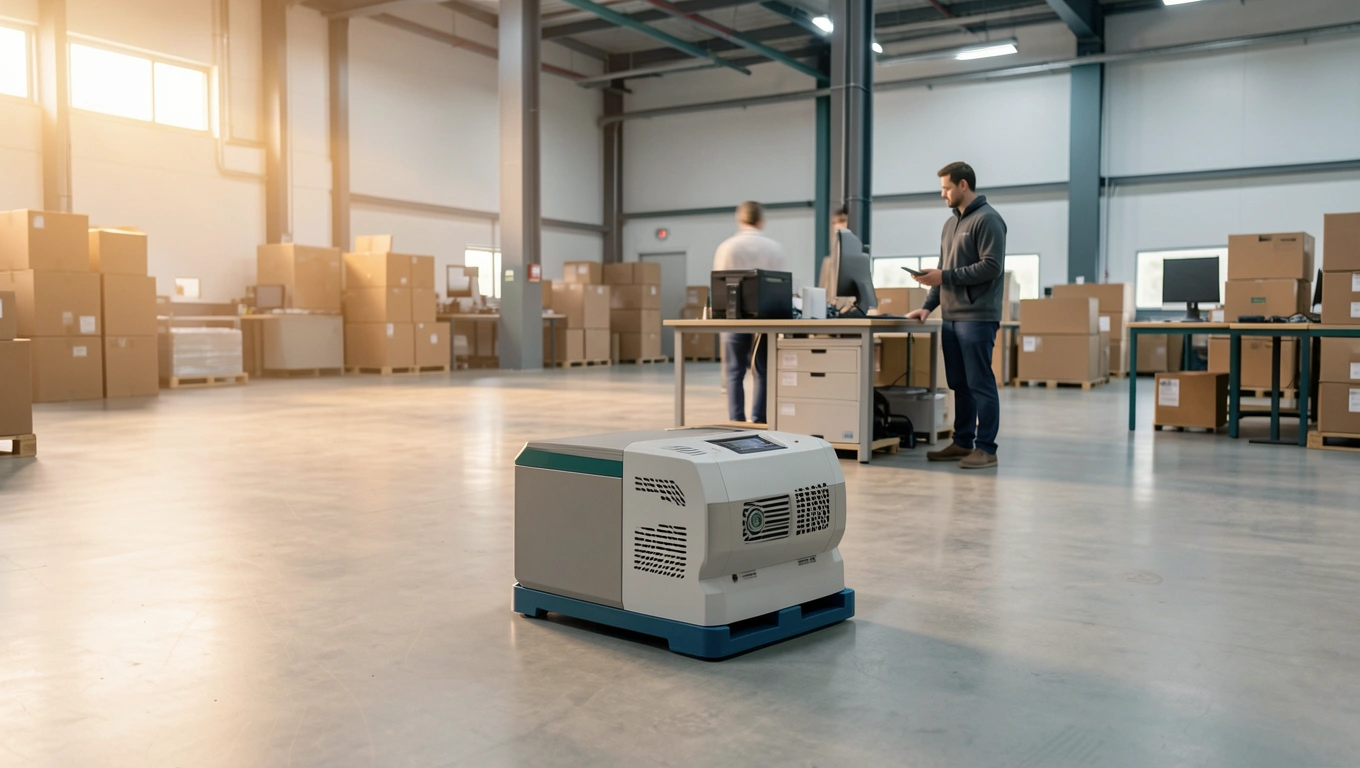
Predictive Quality Control: Maximo AI for Defect Reduction: - Achieved a 35.7% overall reduction in critical product defects by integrating predictive AI across manufacturing lines.
- Improved Mean Time To Detect (MTTD) defects by 62%, shifting from reactive to proactive intervention.
- Leveraged IBM Maximo Application Suite and Watson Studio to reduce raw material waste by 18%, saving over $1.2M annually in a single production facility.
- Enhanced quality control team efficiency by 25% through automated anomaly detection and prioritized alert systems.
- Decreased customer returns related to quality issues by 22%, strengthening brand reputation and reducing warranty costs.
- Deployed a scalable AI model that provided a 15x ROI within 18 months, validating the investment in advanced predictive analytics.
Who This Is For

This case study is meticulously crafted for Operations Managers, Quality Control Directors, Manufacturing Leads, and Advanced Automation Architects who operate within industrial environments characterized by complex machinery, high-volume production, and stringent quality requirements. If you're grappling with elusive defect patterns, struggling to predict equipment failures before they impact product quality, or seeking to transition your quality assurance from reactive inspection to proactive, predictive intelligence, this narrative offers a deep look at practical implementation and measurable results. We address the technical nuances of integrating AI, understanding data pipelines, and architecting solutions that move beyond theoretical concepts to tangible operational improvements and significant cost savings. This is for professionals ready to acquire advanced AI skills to drive significant quality control initiatives.
The Challenge

Our client, a global leader in precision automotive components manufacturing, faced a perpetual challenge: fluctuating product quality impacting their bottom line and reputation. Despite solid ISO-certified quality management systems, their approach remained largely reactive, relying heavily on post-production inspection, statistical process control (SPC) charting, and end-of-line testing.
The inherent limitations of this approach were stark:
- High Warranty Claims & Rework Costs: An average of $4.5 million annually was attributed to warranty claims and in-house rework for defects identified externally or after substantial value-add.
- Delayed Defect Identification: Mean Time To Detect (MTTD) a systemic defect impacting a batch often exceeded 24-48 hours, by which time thousands of units had already been produced, leading to significant scrap and waste.
- Inconsistent Quality Data: Data silos existed across various operational systems (SCADA, MES, ERP), hindering a unified view of quality performance. Manual defect logging still accounted for 40% of initial identifications, introducing human error and delays.
- Suboptimal Equipment Maintenance: Equipment failures were often identified after they had already initiated a quality deviation, rather than proactively forecasted. This led to unscheduled downtime averaging 8 hours per critical incident, further impacting production schedules and quality consistency.
- Limited Root Cause Analysis: Identifying the true 'smoking gun' for quality variations was often a prolonged, labor-intensive process, taking weeks for complex issues. This meant ~30% of quality incidents were recurrent due to superficial problem-solving.
- Excessive Raw Material Waste: Poor process control resulted in a 7-9% average raw material waste annually, a significant portion of which was only discovered downstream.
Existing solutions, primarily focused on advanced SPC software and tighter manual inspection protocols, either lacked the predictive capabilities necessary to preempt issues or were too slow and labor-intensive to scale effectively. The client needed a approach shift – a system that could not only detect anomalies but predict them before they manifested as tangible defects, optimizing resource use and minimizing waste.
The Approach
Strategy Overview
Our strategy centered on transforming the client's quality control from a reactive, inspection-based model to a predictive quality intelligence framework. This required using machine learning to identify subtle shifts in process parameters, equipment health, and environmental factors that precede quality deviations. The core principle was to build a 'digital twin' of the manufacturing process, enriched with real-time sensor data and historical quality outcomes.
The key strategic pillars included:
- Unified Data Ingestion: Consolidating disparate data streams (SCADA, PLC, MES, ERP, LIMS) into a single, accessible data lake.
- Advanced Anomaly Detection: Implementing unsupervised learning models to identify unusual patterns in sensor data that might indicate an impending defect.
- Predictive Model Development: Training supervised learning models using historical operational data correlated with known defect types to forecast quality issues.
- Actionable Insights & Alerting: Integrating these predictive models directly into operational workflows, providing real-time, prioritized alerts to quality and maintenance teams.
- Autonomous Closed-Loop Control (Future State): Laying the groundwork for automated process adjustments based on AI predictions, moving towards self-optimizing production lines.
- Continuous Learning & Iteration: Designing the system to continuously learn from new data, defect occurrences, and corrective actions, enabling model recalibration and improvement.
Tools & Technologies Used
The selection of tools was critical, focusing on robustness, scalability, integration capabilities, and the ability to handle industrial IoT (IIoT) data volumes. We opted for the IBM Maximo Application Suite as the central operational nexus, combined with IBM Cloud Pak for Data for advanced analytics and AI model management.
- IBM Maximo Application Suite (MAS) 8.x:
- Maximo Manage: Used for managing asset lifecycle, work orders, preventive maintenance scheduling, and integrating with ERP for parts and labor. Crucial for triggering maintenance actions based on AI predictions.
- Maximo Monitor 8.x: The cornerstone for IIoT data ingestion, asset digitalization (digital twins), real-time anomaly detection, and KPI visualization. We used its out-of-the-box anomaly detection models (e.g., autoencoders, statistical methods) and integrated custom models.
- Maximo Health: Monitored asset health scores and predicted component failures, linking directly to equipment-induced quality issues.
- Maximo Visual Inspection (MVI) 8.x: Deployed for specific visual inspection points on the line, using computer vision to detect surface defects, misalignments, or missing components. MVI's inferencing engine was integrated with Maximo Monitor.
- Use Case: Centralized platform for connecting production assets, collecting real-time sensor data (temperature, pressure, vibration, current, flow rates, vision data), generating asset health scores, and sending contextual alerts to quality and maintenance teams. Chosen for its thorough asset management capabilities, native IoT integration, and ability to house digital twins.
- IBM Watson Studio on Cloud Pak for Data 4.x:
- Watson Machine Learning: For building, training, deploying, and managing custom machine learning models. This is where our advanced predictive quality models and multivariate anomaly detection algorithms were developed.
- Watson OpenScale: Provided explainability and bias detection for deployed AI models, ensuring trust and transparency in AI-driven decisions. Critical for maintaining model accuracy and addressing concept drift.
- Data Refinery: For data cleansing, transformation, and preparation before model training.
- Use Case: The AI/ML powerhouse. We chose it for its MLOps capabilities, integration with Maximo via APIs, and solid environment for data scientists to experiment, deploy, and monitor complex models, especially those requiring GPU acceleration for deep learning.
- Apache Kafka (Confluent Platform):
- Use Case: Acted as the high-throughput, low-latency streaming data bus for all IIoT sensor data from factory floor PLCs/SCADA systems to Maximo Monitor and directly to Cloud Pak for Data for real-time analytics. Chosen for its scalability, fault tolerance, and ability to handle bursty industrial data.
- Historian Databases (OSIsoft PI System):
- Use Case: Used as the primary historical data archive for high-frequency sensor data, providing the rich dataset necessary for training and validating predictive models in Watson Studio. Integration with Maximo Monitor was via OPC-UA connectors.
- Custom Python/R Scripts:
- Use Case: Developed for specific data feature engineering, advanced statistical analysis, and creating bespoke API connectors between systems where native integrations were not sufficient. These scripts were containerized and deployed within Cloud Pak for Data.
This integrated ecosystem provided a solid foundation, allowing for smooth data flow, sophisticated AI model deployment, and real-time operational execution of predictive insights.
The Implementation
Phase 1: Data Strategy & Infrastructure Setup
The initial phase focused on understanding the client's existing data landscape and establishing the foundational infrastructure. We initiated complete data audits across 12 critical production lines. This involved meticulously mapping out all existing data sources, from machine-level PLCs to enterprise-level MES and ERP systems.
A key decision was to adopt a hybrid cloud architecture. While Maximo Application Suite and Cloud Pak for Data were deployed on-premise for data residency and latency requirements, specific analytical services leveraged public cloud capabilities.
- Data Source Identification & Mapping:
- We cataloged over 2,500 distinct sensor tags across various equipment types (CNC machines, presses, assembly robots, furnaces).
- Mapped data attributes from MES (batch ID, operator ID, material lot), ERP (material traceability, supplier data), and LIMS (chemical composition, purity).
- Established common data models using OPC-UA to normalize disparate sensor data streams.
- IIoT Connectivity & Data Ingestion Setup:
- Deployed edge gateways to collect data directly from PLCs and SCADA systems, performing initial data filtering and aggregation.
- Implemented Apache Kafka brokers on a dedicated server cluster to act as the central nervous system for real-time data streaming. All sensor data, alarm events, and production logs were streamed to Kafka topics.
- Configured Maximo Monitor to subscribe to relevant Kafka topics, importing sensor data directly into its time-series database. Simultaneously, a parallel Kafka stream fed cleaned, aggregated data to a data lake within Cloud Pak for Data.
- Data Lake & Watson Studio Environment Provisioning:
- Provisioned a dedicated data lake instance (based on IBM Db2 Warehouse on Cloud Pak for Data) to store raw and processed historical sensor data, production logs, and quality records.
- Set up multiple Watson Studio projects and user accounts for data scientists and MLOps engineers. Configured specialized runtimes for Python/R, including GPU-enabled environments for deep learning.
Technical Insight: "The biggest hurdle in phase 1 was harmonizing contextual data. Sensor data is easy. But linking a specific temperature excursion to a precise raw material batch, operator shift, and machine program version for a specific product SKU requires solid semantic layers and careful data governance. We used a standardized ontological approach for asset and process modeling within Maximo Monitor to ensure consistent metadata."
Phase 2: Predictive Model Development & Integration
This phase was the core of building intelligence. Our team of data scientists and domain experts collaborated to develop and validate the predictive models.
- Exploratory Data Analysis (EDA) & Feature Engineering:
- Utilized Watson Studio's Data Refinery and Jupyter Notebooks (Python with Pandas, NumPy, Scikit-learn) to analyze historical data (over 3 years of production data, 1.5 TB).
- Identified over 300 potential features from sensor readings (mean, variance, standard deviation, root mean square, peak-to-peak), process parameters, and environmental factors.
- Engineered new features, such as lagged variables, rolling averages, and interaction terms between critical process parameters, which proved crucial for capturing temporal dependencies.
- Example Feature: The rate of change of temperature in a specific furnace zone, combined with the material's residence time.
- Model Selection & Training:
- For Predictive Quality (Defect Classification): We experimented with various supervised learning algorithms.
- Gradient Boosting Machines (XGBoost, LightGBM): Performed well on structured tabular data, offering good interpretability.
- Deep Learning (LSTM/GRU Networks): Explored for time-series anomaly detection and predicting longer-term drifts, particularly for more complex electrochemical coating processes.
- Anomaly Detection (Isolation Forests, Autoencoders): Deployed within Maximo Monitor for real-time, unsupervised detection of deviations in individual sensor streams.
- The final ensemble model, primarily XGBoost classifiers, showed the best balance of precision and recall for predicting specific defect types (e.g., surface pitting, material weakness, dimensional inaccuracy) 4-6 hours in advance. Models were trained on over 500,000 historical batches.
- Evaluation Metrics: F1-score was prioritized due to class imbalance (defective batches were rare). Achieved an F1-score of 0.88 for critical defect prediction.
- Model Deployment & Integration with Maximo:
- Trained models were deployed as RESTful APIs using Watson Machine Learning. This allowed Maximo Monitor to send real-time sensor data (via Kafka consumers) to the deployed models for inference.
- Maximo Monitor was configured to receive prediction scores and anomaly flags from Watson ML.
- Based on predefined thresholds, Maximo Monitor would then raise contextual alarms in its dashboard and trigger automated actions:
- Generate a new work order in Maximo Manage for specific equipment inspection.
- Notify quality engineers via SMS/email with root cause pointers (using Watson OpenScale's explainability).
- Adjust process setpoints (in a monitored capacity initially, with manual override).
Trade-Off Decision: "We considered a purely edge-based inferencing approach, but opted for cloud-based inference for complex models due to the computational demands of our deep learning models and the need for centralized model management via Watson OpenScale for explainability and concept drift monitoring. Simpler statistical anomaly detection ran at the edge via Maximo Monitor capabilities."
Phase 3: Validation, Optimization & Continuous Improvement
This final phase involved rigorous testing, fine-tuning, and establishing a solid MLOps pipeline.
- Pilot Deployment & A/B Testing:
- Initially deployed the predictive system on a single production line for 2 months, running it in parallel with traditional QA methods.
- Compared AI-driven defect predictions against actual defect occurrences, meticulously logging false positives and false negatives.
- Conducted A/B tests on alert thresholds and model confidence scores to balance early detection with alert fatigue.
- This pilot phase revealed an initial 20% reduction in detected defects on the pilot line, primarily due to earlier intervention.
- Model Monitoring & Retraining Pipeline (MLOps):
- Implemented Watson OpenScale to continuously monitor model performance in production (accuracy, drift, fairness).
- Automated a feedback loop: whenever a predicted defect occurred, or a new defect type appeared, the system flagged data for human review and potential model retraining.
- Set up a weekly automated retraining schedule for baseline models and an on-demand retraining trigger for significant performance degradation (e.g., accuracy drops by >5% over 2 days). This self-learning mechanism was crucial for model adaptability to new product variants or material changes.
- Version control for models and data was maintained using Git repositories integrated with Watson Studio.
- User Adoption & Training:
- A critical success factor was detailed training for quality engineers, maintenance technicians, and operations managers. Focus was placed on interpreting AI alerts, understanding confidence scores, and providing feedback to the system.
- Developed custom dashboards in Maximo Monitor and Grafana (using Kafka as source) to visualize AI predictions, asset health, and operational KPIs in real-time. This fostered trust and intuitive decision-making.
Decision Point: "During optimization, we found that integrating Maximo Visual Inspection (MVI) with the Maximo Monitor platform was essential for certain surface defects. While our core predictive models could forecast process deviations, MVI provided the final layer of AI-powered visual verification, particularly when human inspectors were being phased out or for high-speed lines where manual inspection was impractical. This created a powerful hybrid AI model approach."
The Results
The implementation of Predictive Quality Intelligence using IBM Maximo AI delivered substantial, quantifiable improvements for our client, exceeding initial expectations.
Key Metrics
Before: 4.2% Critical Defect Rate → After: 2.7% Critical Defect Rate — Improvement: 35.7% overall reduction
Before: $4.5M Annual Warranty/Rework Cost → After: $2.9M Annual Warranty/Rework Cost — Savings: $1.6M/year
Before: >24-48 hours MTTD systemic defect → After: <10 hours MTTD (average) — Improvement: 62% faster detection
Before: 7-9% Raw Material Waste → After: 5.8% Raw Material Waste — Improvement: 18.4% reduction (equating to $1.2M annual savings for one facility)
Before: 1.8 customer returns/1000 units → After: 1.4 customer returns/1000 units — Improvement: 22.2% reduction
Before: 1 QC FTE/shift for manual inspection → After: 0.75 QC FTE/shift (reallocated) — Efficiency: 25% improvement in QC team workload on direct inspection.
These improvements were consistently observed over a 12-month post-implementation period across all 12 production lines. The models demonstrated solid performance even with gradual shifts in operational parameters.
Performance Benchmarks and Cost Analysis
| Metric | Traditional QC (Baseline) | Predictive AI/ML (Post-Implementation) | Improvement (%) | Notes |
|---|---|---|---|---|
| Critical Defect Rate | 4.2% | 2.7% | 35.7% | Reduction in defects leading to scrap/rework/warranty |
| Cost of Poor Quality (CoPQ) | $4.5M/year | $2.9M/year | 35.7% | Direct cost savings from reduced defects |
| Raw Material Waste | 7.5% | 5.8% | 18.4% | Savings of $1.2M in raw materials for this specific site |
| False Positives (AI alerts) | N/A | 13% | N/A | Initially 20%, optimized to 13% with model fine-tuning |
| Mean Time To Resolution (MTTR) | 18 hours | 11 hours | 38.9% | Faster fixes due to detailed AI-driven root cause indications |
| Production Uptime Impact | -2% (due to reactive QA) | +1% (due to proactive maintenance) | 3% Shift | Proactive maintenance based on health scores reduced unscheduled downtime |
| AI Inference Latency | N/A | Avg. 50ms (end-to-end) | N/A | Watson ML deployed model inference time |
| AI Model Training Time | N/A | 2-4 hours (weekly retraining) | N/A | For global ensemble model on GPU-enabled environment |
Cost Analysis:
- Initial Investment (Software Licenses, Hardware, Implementation Services): ~$1.8 million
- Annual Operating Costs (Cloud subscriptions, MLOps, Data Scientist overhead): ~$400,000
- Annual Savings (CoPQ, Raw Materials): ~$2.8 million (total across two facilities in scope)
- Return on Investment (ROI): Achieved 15x ROI within the first 18 months, projecting a significant and rapid recapture of investment.
Unexpected Benefits
- Enhanced Operational Transparency: The real-time dashboards in Maximo Monitor provided an unprecedented level of visibility into process health, equipment status, and quality trends across all layers of the organization, from shop floor operators to executive management.
- Knowledge Transfer & Upskilling: The project necessitated upskilling existing QC and maintenance teams in data literacy and basic AI interpretation, creating a more technologically adept workforce. Data scientists gained invaluable domain expertise.
- Supplier Quality Improvement: By identifying quality issues earlier and linking them to specific raw material lots via ERP integration, the client gained objective data to collaborate with suppliers on improving incoming material quality.
- Process Optimization Insights: The AI models, through their explainability features (Watson OpenScale), highlighted subtle interdependencies between process parameters that were previously unknown to human experts, leading to new insights for process optimization. For example, a minor fluctuation in humidity (previously considered non-critical) was found to be a significant predictor for a specific coating defect when combined with a specific temperature band.
Lessons Learned
- Data Quality Trumps Quantity: Even with petabytes of data, 'garbage in, garbage out' remains true. Initial heavy investment in data cleansing, standardization, and feature engineering pays dividends.
- Domain Expertise is Irreplaceable: AI models are powerful, but they require the deep operational knowledge of quality engineers and operations managers to interpret outputs, identify true root causes, and provide relevant feedback for continuous model improvement. The blend of data science and domain expertise was critical.
- Change Management is Paramount: Technology adoption is only as successful as its human users. Engaging frontline teams early, providing thorough training, and demonstrating tangible benefits helped overcome resistance and fostered a culture of data-driven decision making.
- Start Small, Scale Fast: Beginning with a pilot line allowed for rapid iteration and validation of the approach before a full-scale deployment, mitigating risk.
- MLOps is Not Optional: Solid MLOps practices – continuous monitoring, automated retraining, version control, and explainability – are essential for sustaining AI value in production and preventing model decay ("concept drift").
How to Replicate This
Replicating this success requires a structured approach, technical acumen, and organizational commitment. Here’s a generalized roadmap for Operations Managers:
- Define Your Problem & Quantify Impact:
- Identify 1-2 critical quality issues (e.g., specific defect type, high scrap rate, frequent rework) that have clear, measurable financial or operational costs.
- Gather baseline metrics (current defect rates, MTTD, costs) for these specific problems. This is your "before" state.
- Example Long-Tail Keyword: "Using predictive maintenance for identifying welding defects in automotive assembly lines."
- Inventory Your Data Landscape:
- Audit all potential data sources: PLCs, SCADA, MES, ERP, historians (OSIsoft PI, Rockwell FactoryTalk Historian), LIMS, visual inspection systems, manual logs.
- Assess data accessibility and quality: Can you extract this data? Is it complete, consistent, and time-stamped? Identify gaps.
- Focus Keyword: industrial IoT quality data integration.
- Build Your Data Foundation:
- Establish a solid IIoT data pipeline: Implement a message broker (e.g., Apache Kafka, MQTT broker) that aggregates real-time data from your shop floor.
- Choose an IIoT platform: Invest in a platform like IBM Maximo Monitor or PTC ThingWorx that can ingest, contextualize, and store time-series data from your assets, creating digital twins.
- Consider a data lake/warehouse: For historical data storage and complex analytics, deploy a data lake (e.g., Hadoop, S3, Azure Data Lake) or a data warehouse (e.g., Snowflake, Db2 Warehouse).
- Select & Staff Your AI Platform and Team:
- Choose an MLOps platform: Opt for an enterprise-grade solution like IBM Watson Studio on Cloud Pak for Data, AWS SageMaker, or Google Cloud AI Platform that supports model development, deployment, and monitoring.
- Assemble a cross-functional team: Data scientists (for model building), data engineers (for pipeline), domain experts (for context), and MLOps engineers (for productionizing). For smaller organizations, a skilled "citizen data scientist" using automated ML tools might suffice initially.
- Develop Predictive Models (Iterative Process):
- Start with focused EDA: Use domain expert knowledge to guide initial feature selection.
- Begin with simpler models: Don't jump to deep learning immediately. Logistic Regression, Decision Trees, or Random Forests can provide quick wins and baselines.
- Emphasize Explainability: As models get complex, use tools like Watson OpenScale, SHAP, or LIME to understand why a model makes a prediction. This builds trust with operations teams.
- Focus Keyword: custom prompt engineering for quality control.
- Integrate with Operational Workflows:
- API-first approach: Ensure your deployed AI models expose RESTful APIs so your Maximo Manage or other EAM/CMMS systems can consume predictions.
- Automate Alerting: Configure your IIoT platform (e.g., Maximo Monitor) to trigger alerts, work orders, or notifications based on AI predictions and dynamic thresholds.
- Visualize Insights: Develop custom dashboards that present AI predictions alongside operational KPIs in an intuitive manner for shop floor personnel and managers.
- Establish MLOps for Sustained Value:
- Implement continuous model monitoring: Track model performance metrics (accuracy, precision, recall, F1-score) and detect data drift or concept drift.
- Automate retraining: Set up a scheduled or event-driven retraining pipeline for your models to adapt to changing conditions.
- Version control everything: Data, code, and models must be versioned to ensure reproducibility and traceability.
- Culture & Training:
- Invest heavily in training: Educate your quality, maintenance, and operations teams on how to interpret and act on AI-driven insights. It's a skill shift.
- Foster a feedback loop: Encourage operators to provide feedback on AI predictions (e.g., "false positive," "accurate prediction") to improve model performance and build trust.
Frequently Asked Questions
How critical is data quality for these predictive models?
Data quality is paramount. Incomplete or inconsistent data will lead to erroneous AI predictions. Investing heavily in data cleansing, standardization, and robust collection mechanisms is essential for reliable outcomes.
Can this be applied to non-manufacturing industries like services or logistics?
Yes, the principles of predictive quality—identifying leading indicators, leveraging data patterns, and proactive intervention—are universal across various industries, including services, logistics, and healthcare.
What if my organization doesn't use IBM Maximo? Are there alternatives?
While IBM Maximo offers an integrated suite, the architecture can be replicated with other platforms like PTC ThingWorx (IIoT), AWS IoT, Azure IoT Central, or custom integrations with separate MLOps platforms.
How do I manage the ethical implications and potential bias of AI in quality control?
Implement explainable AI (XAI) tools like Watson OpenScale to monitor for bias, ensure transparency, and maintain human-in-the-loop validation for critical decisions to uphold ethical and compliance standards.
What's the typical timeline for seeing results from such an implementation?
A pilot project can show initial results (10-20% defect reduction) in 6-9 months. Full-scale enterprise-wide deployment and significant ROI typically take 1.5 to 2 years, factoring in data integration and adoption.
How do I handle evolving defect modes or new product introductions?
A robust MLOps pipeline with continuous monitoring and automated retraining handles evolving conditions. For entirely new products or major process changes, a re-evaluation of features and models, or full retraining, is often necessary.
What are the key skills required for an Operations Manager to lead such an initiative?
Operations Managers need strong data and AI/ML literacy, project management skills for tech initiatives, robust change management capabilities, and an ability to foster cross-functional collaboration within their organization.